
Brown University is located in Providence, Rhode Island and was founded in 1764. Brown is a distinguished Ivy League College and is one of the oldest institutions of higher learning in the United States. It is renowned for its unique open curriculum and commitment to academic exploration. Brown encourages its students to conduct research and engage in interdisciplinary study in order to ensure all graduates are well rounded.
This university is known for its highly selective admissions process that seeks well-rounded individuals with a passion for learning and a drive for innovation. The admissions officers want each incoming class to be diverse, dynamic, and engaged with a wide range of ideas and perspectives. In particular, Brown is looking for students who take initiative in their own learning journey, are motivated enough to stick with rigorous curriculums, and are interested in making a meaningful impact to campus life by engaging with the community. Some people may be surprised to learn that Brown values more than just high test scores; they also care about students being engaged in life outside of the classroom. Applicants can demonstrate community engagement through clubs, sports, arts, or community service. Those examples demonstrate leadership, commitment, and personal growth, and they reflect positively on students’ applications.
Brown is consistently ranked among the top 20 best colleges in the United States. It is known for having strong programs in the following fields: literature, history, biology, computer science, and visual arts. Some notable alumni of the university include actors Emma Watson and John Krasinski, founder of CNN Ted Turner, US Secretary of the Treasury Janet Yellen, and entrepreneur Andrew Yang.
This blog post will provide information about Brown University’s recent statistics, including numbers about their undergraduate enrollment, percentage of majors accepted, student demographics, and more. It will also include contact information for the university.
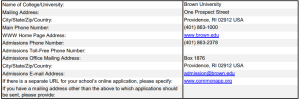
Contact Information
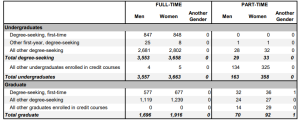
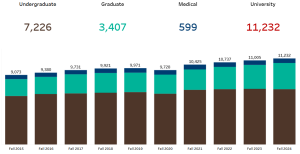
Enrollment by Gender and Year
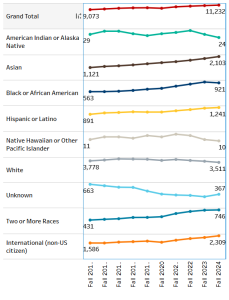
Enrollment by Ethnicity
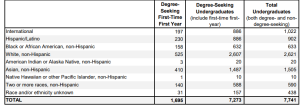
Federal Reporting of Brown’s Enrollment by Ethnicity
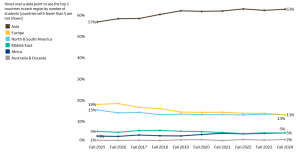
Statistics for International Student Enrollment by Year
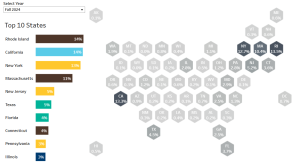
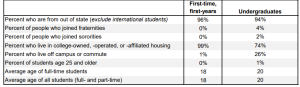
Percentages of Students by US State
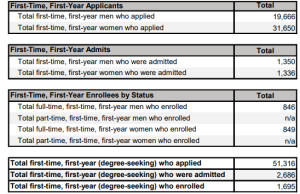
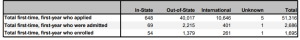
Numbers of Students who Applied, were Admitted, and were Enrolled
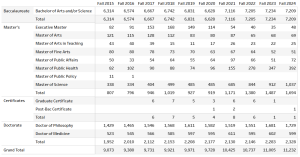
Number of Students by Degree Type and Year
Number of Students by Major and Year
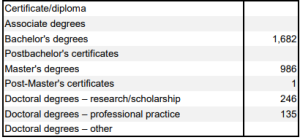
Number of Degrees Awarded
The data in the following chart was collected from students who earned degrees between July 1st, 2022 and June 30th, 2023.
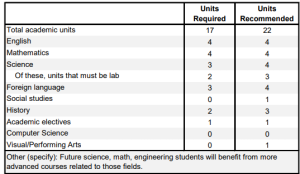
Required and Recommended Units of High School Subjects
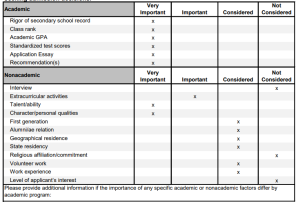
Importance of Various Academic and Non-Academic Factors in Admission
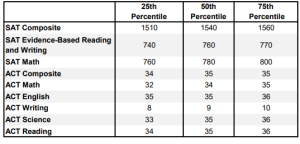
SAT and ACT Scores of Freshmen Students at Brown
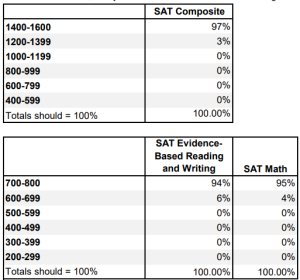
SAT Scores of Freshmen Students
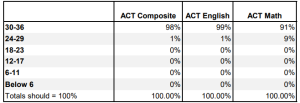
ACT English and Math Scores of Freshmen Students
Class Rank of Freshmen Students
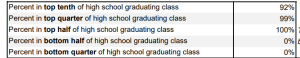
*note: only 28% of freshmen submitted their class rank in the 2023 admission cycle, and the chart above draws solely on those points of data*
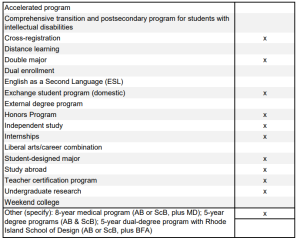
Special Programs of Study Available at Brown
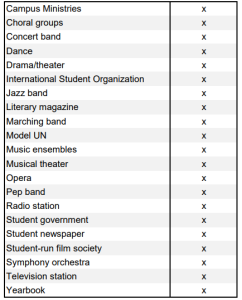
Student Life at Brown
Programs Available at Brown
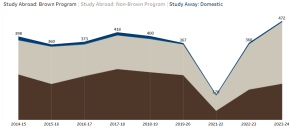
Study Abroad Program Numbers by Year
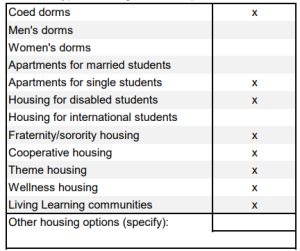
Types of Housing Available for Undergraduate Students
Faculty Statistics
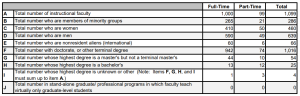
Brown boasts an impressively low student to faculty ratio of 6 students to 1 faculty member!
Degrees Conferred
The following data reflects students who earned degrees between July 1st, 2022 and June 30th, 2023.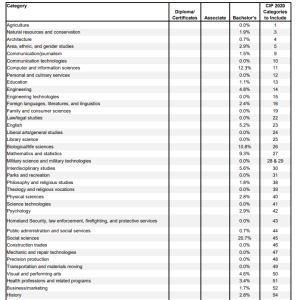
To view additional information about Brown’s enrollment, please contact MMT Prep or visit Brown’s website: https://oir.brown.edu/institutional-data/factbooks/enrollment


Leave A Comment